

Many companies struggle to find a reasonable way to assess developers, and the internet is rife with developers debating the merits of algorithmic questions or convoluted whiteboarding interviews.
However, I had the chance to interview with a company that found a better way. In order to test if I could do the job, they had me do the job (crazy, I know). After some standard interview questions, we sat down and debugged a problem that used to exist in their application.
A lot of developers would find that daunting. How do you fix a bug in a codebase you have never worked with before? In this article, you’ll learn the technique I used to ace that interview and receive an offer!
Binary Search
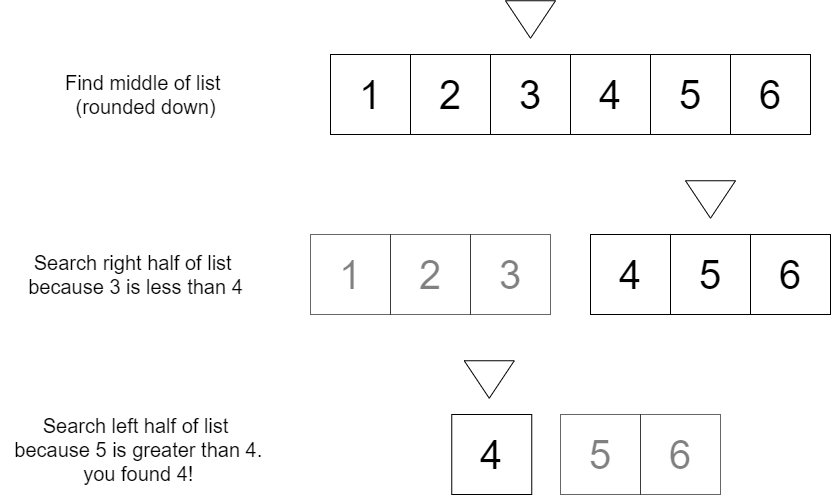
Binary search is often associated with an algorithm that lets you efficiently find a number in a sorted list. You start by finding the middle of your list. If it’s higher than your desired number, you search the low half of the list. If it’s lower than your desired number, you search the high half of the list. Like this:
So why am I telling you about a method for finding numbers in a list? Because you can apply this mental framework to debug a program in fewer steps.
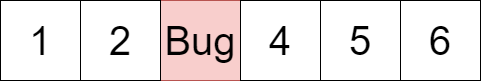
Somewhere in your program, you have a bug. And you can use binary search to find it.
Debugging Using Binary Search
The goal of debugging using binary search is to find the cause of a bug in fewer steps and reduce how much of the codebase you need to read and reason about to resolve the issue.
To debug using binary search, you can follow these steps.
- Reproduce the bug and determine the minimal steps needed to produce the issue. This is an important step no matter how you’re debugging a problem.
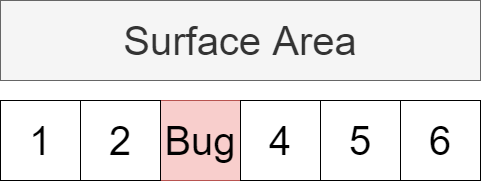
- Determine the surface area. The surface area is the part of your application where the bug resides. More importantly, this lets you ignore parts of the application. When binary searching a list of numbers, you don’t want to check every number. Likewise, when binary searching an application, you don’t want to read every line of code. You can break up the surface area into the causal area and the affected area.
- Determine the affected area. The surface area includes everything touched along the way to reproduce the bug. The affected area is the specific moment that the bug occurs. This lets you narrow your focus down even more.
- Binary search the affected area using a debugger or print statements to follow the flow of your application, ignoring paths that do not produce the bug. Find the smallest piece of code you can which contains the bug.
- Determine the causal area. The causal area includes any parts of your application that interact with or relate to your issue. Understanding the causal area helps you understand why your bug exists in the first place.
- Develop a solution based on your understanding of the surface area. Once you understand why a bug exists, you can usually use that knowledge to develop a solution for it.
Reproduce the Bug
To define the surface area of the bug, you need to be able to reproduce it consistently. This is the first step in debugging any problem. If you cannot consistently reproduce the bug, it won’t be easy to solve it.
By creating a list of steps to reproduce the bug, you can define the start and finish for the surface area of the bug. Reproduction steps may look something like this:
1. Open the application.
2. Sign in as an owner user.
3. Fill in the payment form.
4. Sign in as an employee user.
5. Navigate to the payment page.
6. Observe a 404 Unauthorized response.
Make the reproduction steps as minimal as possible, and you will naturally reduce the area of your codebase you need to look at.
This is extremely important in large codebases where you don’t possibly have the time to understand the whole system.

Determine the Surface Area of the Bug
Unlike in a list, there’s no clear end, middle, and start to your application. So first, you need to start by understanding the area that your bug exists inside. The surface area is directly related to the reproduction steps. It’s every line of code executed while you reproduce the bug.
Your goal is to diagnose the surface area of the bug and continuously reduce the surface area that the bug could be inside of — just like when we found the number 4 in a list earlier!
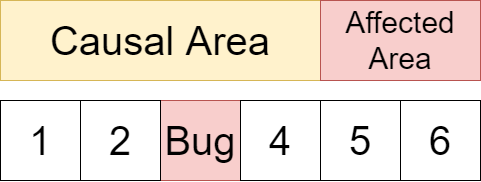
To help think about the surface area of the bug, you can separate the surface area into the causal area and the affected area. In this case, the causal area is the series of steps leading up to the bug’s behavior. The affected area is the moment you observe the bug.
Determine the Affected Area of the Bug.
In the example above, the affected area is when the user requests the payment page resources and instead receives a 404 unauthorized response.
5. Navigate to the payment page.
6. Observe a 404 Unauthorized response.
By defining this area, you can limit your initial search from the initial request to the end of the unauthorized response.
Binary Search the Affected Area
To binary search the affected area, define an entry point in the code that you can start to debug more thoroughly. The goal is to spend as little time reading and reasoning about code as possible because this is time and energy-intensive. Instead, follow the execution flow of the application to determine the moment that the bug occurs.
Consider Using a Debugger
Some developers will put print statements in their applications to inspect values and determine when the bug occurs. This works fine, but it’s even better if you can use a debugger. A debugger lets you step through your code as it executes so that you can freely watch its flow and inspect values.
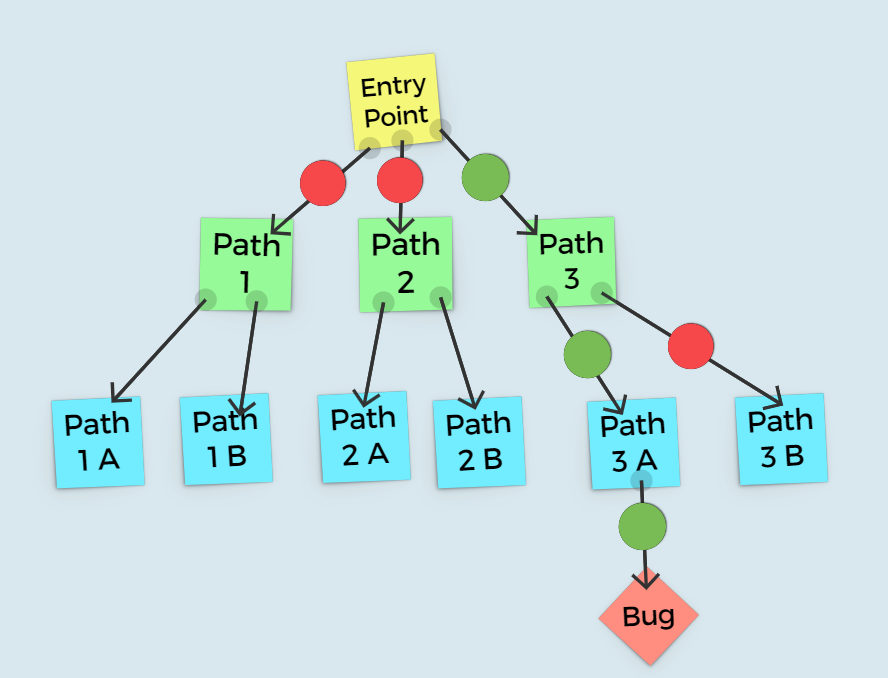
If you imagine your affected area as a graph, the process of going through the flow of your codebase ignoring paths that do not lead to your bug will look like this. The green dots represent the path you follow, and the red dots represent the paths you ignore.
Avoid Reasoning About the Code
This might feel counter-intuitive but only once you’ve narrowed your search down to the smallest possible area do you allow yourself to read and reason about the code. In my experience development is a marathon, not a sprint. If you can save mental energy then you should.
Think of it as a conversation with your code. Like in a conversation, you have to listen first and then think about your response. Things go wrong when you think about what you’re going to say next while the other person is talking.
I’ve seen developers get frustrated and overwhelmed because they think in order to make progress on a problem they need to understand the entire system. Only understand and read what is necessary to solve a problem, your brain will thank you.

Instead of reasoning about what path the code “should” take, pick an entry point that seems reasonable given your reproduction steps and follow the flow of the program. Use print statements or a debugger and let the program do the heavy lifting for you.
In my interview, The entry point to the affected area was the controller for the payment page. I want to keep these techniques platform-agnostic, so you don’t need to know what a controller is to understand this article. If learning more about controllers and MVC infrastructure interests you let me know! I’ll write about it in the future if there’s interest.
In my interview, the controller is responsible for the flow of the program as the user navigates to the payment page. It handles making sure the user is authorized and sends the user the information their browser needs to view the payment page.
By following the controller’s flow and only following the path responsible for sending the unauthorized response, I kept digging down into the code until I came to the last line of code the controller executed.
if (payment_form.user_id !== current_user.id)
send_unauthorized_response()
Once you’ve narrowed down the search, you can reason about the code. In this case, the controller checks the current user’s id against the id of the user who filled out the payment form. If they don’t match, the controller returns a 404 unauthorized response:
Understand the Causal Area
The causal area is the part of the application that could be leading to the bug. Often the interactions leading to a bug can be complex and numerous. By understanding the affected area, you can reduce the causal area.
In the interview example, the causal area starts as the steps leading up to the bug’s behavior.
1. Open the application.
2. Sign in as an owner user.
3. Fill in the payment form.
4. Sign in as an employee user.
Knowing that the payment form sets the user_id to the current user, you can narrow down the causal area to step 3.
3. Fill in the payment form.
Understanding the causal area will help you generate theories and create a good solution to the bug.
Generate and Test Theories that Match the Data
Finding and pinpointing the affected area may be enough to solve the bug. However, there may be some complex interaction inside the causal area that leads to the bug in the affected area.
Using the information you discovered by binary searching the affected area and understanding the causal area, you can develop better theories on why the bug is happening.
A less than ideal way to debug a problem is to generate theories before gathering information. Sometimes you can be lucky and get it right, or if you have a deep understanding of your application, it might be fine to follow your hunch. But it can also lead you down the wrong path and waste time.
In my example case, the user who fills out the payment form could be either an owner or an employee. Both need to be able to access the payment page. However, if the id on the payment form doesn’t match the current user's id, the application sends a 404 unauthorized response.
I developed a theory that we needed to check for both the employee id and the owner id. For the sake of the interview, they let me know that I was correct, and we moved on.
Conclusion
You have learned how to use binary search to find bugs in your application and fix them. However, it’s important to remember that this is a single tool in your debugging toolbelt. This is not a dogmatic process. You can steal parts of this mental framework and apply them as you see fit.
The important part to remember is that you want to reduce the area you read and reason about as much as possible to save time and mental load while debugging. It’s not as important that you follow these specific steps. You may internalize this process and rework it for the problem you’re facing and your own debugging style.
Next time you’re debugging an issue give this method a try, the more you practice the method the more you’ll tailor it for you. Hope it saves you time on your next bug!


%20(1920%20%C3%97%201080%20px).png)